
- Start >
- Rivers >
- Chemistry >
- Untere Donau >
- RUGENMUEHLE >
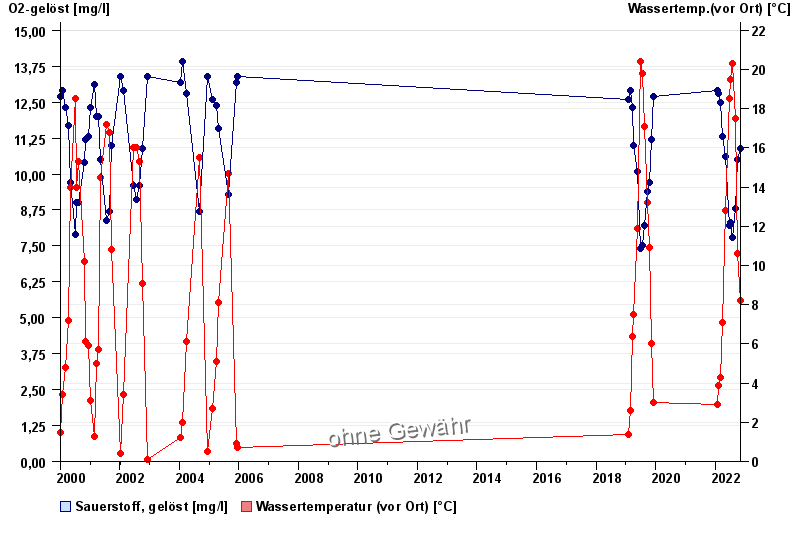
- Chart of total period

Chart of total period RUGENMUEHLE / Schwarzer Regen
Data from 2000-01-04 to 2022-12-06
| Date | O2-gelöst [mg/l] | Wassertemp.(vor Ort) [°C] |
|---|---|---|
| 06.12.2022 | 12.1 | 4.6 |
| 08.11.2022 | 10.9 | 8.2 |
| 04.10.2022 | 10.5 | 10.6 |
| 06.09.2022 | 8.8 | 17.5 |
| 02.08.2022 | 7.8 | 20.3 |
| 06.07.2022 | 8.3 | 19.5 |
| 22.06.2022 | 8.2 | 18.5 |
© Bayerisches Landesamt für Umwelt 2025