
- Start >
- Rivers >
- Chemistry >
- Untere Donau >
- Messstation Pfelling >
- Chart of year

Chart of year Messstation Pfelling / Donau
Data from 2018-01-01 to 2018-12-31
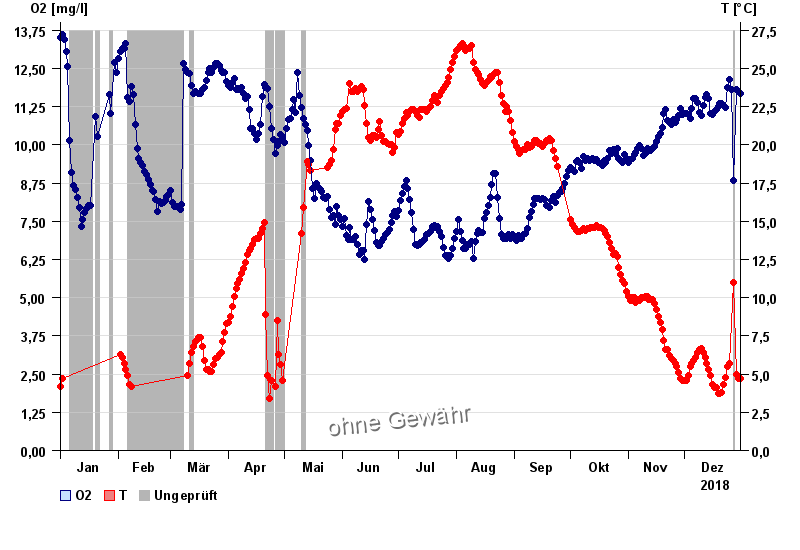
| Date | O2 [mg/l] | T [°C] |
|---|---|---|
| 31.12.2018 | 11.67 | 4.7 |
| 30.12.2018 | 11.76 | 4.7 |
| 29.12.2018 | 11.81 | 5 |
| 28.12.2018 | -- | -- |
| 27.12.2018 | 8.84 | 11 |
| 26.12.2018 | 11.80 | -- |
| 25.12.2018 | 12.13 | 5.7 |
© Bayerisches Landesamt für Umwelt 2024