
- Start >
- Rivers >
- Chemistry >
- Untere Donau >
- Messstation Pfelling >
- Chart of year

Chart of year Messstation Pfelling / Donau
Data from 2017-01-01 to 2017-12-31
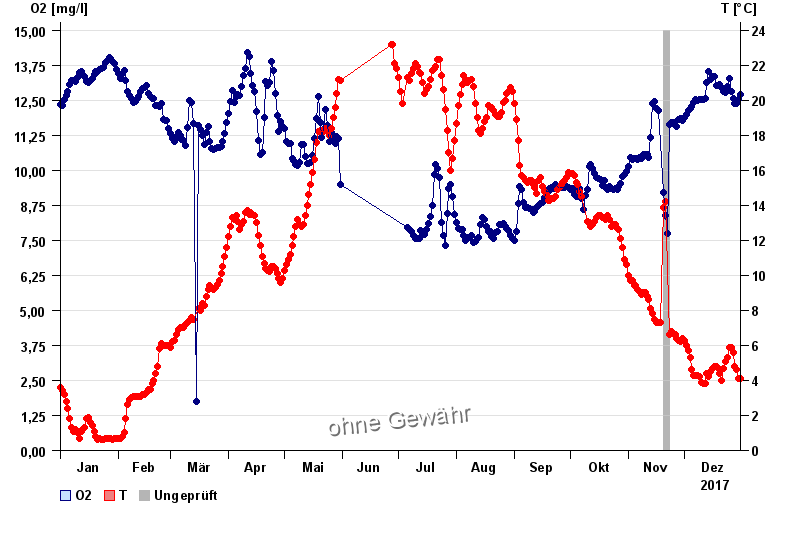
| Date | O2 [mg/l] | T [°C] |
|---|---|---|
| 31.12.2017 | 12.71 | 4.1 |
| 30.12.2017 | 12.53 | 4.1 |
| 29.12.2017 | 12.39 | 4.6 |
| 28.12.2017 | 12.39 | 4.8 |
| 27.12.2017 | 12.57 | 5.6 |
| 26.12.2017 | 12.81 | 5.9 |
| 25.12.2017 | 13.29 | 5.9 |
© Bayerisches Landesamt für Umwelt 2024