
- Start >
- Rivers >
- Chemistry >
- Obere Donau >
- Messstation Ingolstadt Luitpoldstraße >
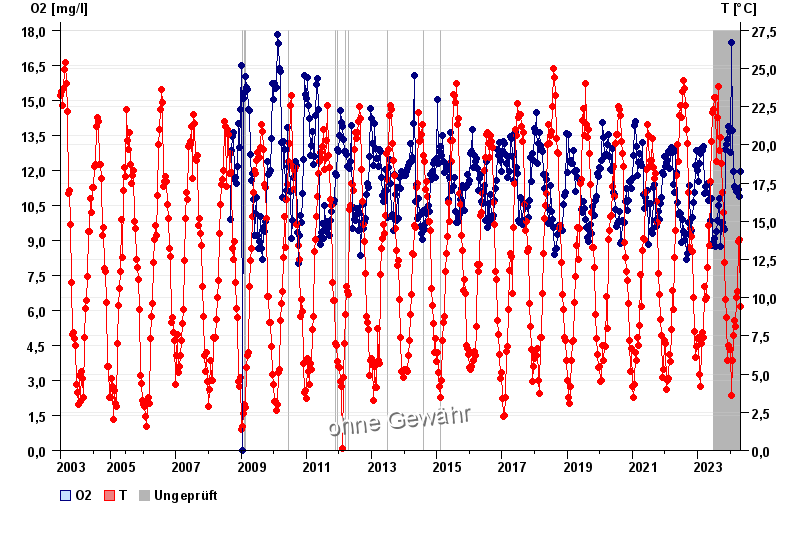
- Chart of total period

Chart of total period Messstation Ingolstadt Luitpoldstraße / Donau
Data from 2003-06-17 to 2024-04-27
| Date | O2 [mg/l] | T [°C] |
|---|---|---|
| 27.04.2024 | 11.75 | 8.8 |
| 26.04.2024 | 11.70 | 8.6 |
| 25.04.2024 | 11.59 | 8.3 |
| 24.04.2024 | 11.51 | 8.3 |
| 23.04.2024 | 11.24 | 8.4 |
| 22.04.2024 | 11.19 | 8.7 |
| 21.04.2024 | 10.88 | 9.3 |
© Bayerisches Landesamt für Umwelt 2024