
- Start >
- Rivers >
- Chemistry >
- Obere Donau >
- 250 m uh. Br. Wollbach >
- Chart of total period

Chart of total period 250 m uh. Br. Wollbach / Zusam
Data from 2016-01-27 to 2022-12-07
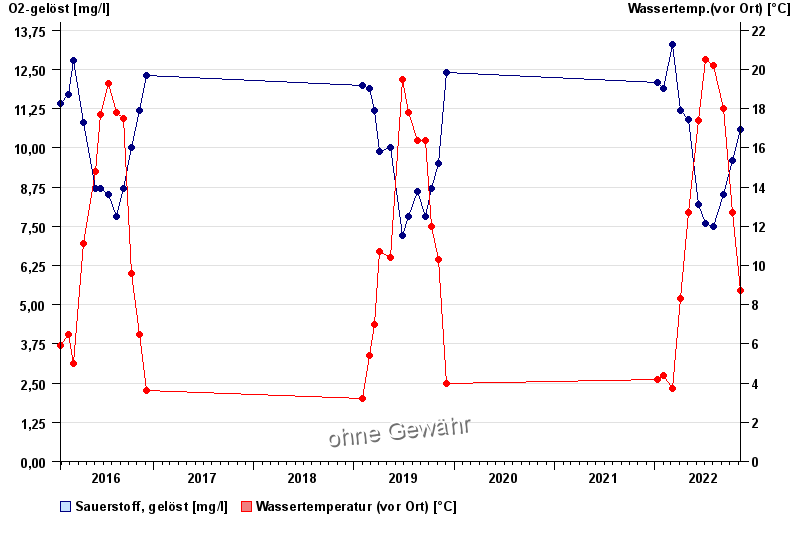
| Date | O2-gelöst [mg/l] | Wassertemp.(vor Ort) [°C] |
|---|---|---|
| 07.12.2022 | 11.2 | 5.6 |
| 09.11.2022 | 10.6 | 8.7 |
| 11.10.2022 | 9.6 | 12.7 |
| 07.09.2022 | 8.5 | 18 |
| 03.08.2022 | 7.5 | 20.2 |
| 05.07.2022 | 7.6 | 20.5 |
| 08.06.2022 | 8.2 | 17.4 |
© Bayerisches Landesamt für Umwelt 2025