
- Start >
- Rivers >
- Chemistry >
- Isar >
- uh. KA Pessenburgheim >
- Chart of total period

Chart of total period uh. KA Pessenburgheim / Kleine Paar
Data from 2010-03-16 to 2019-12-10
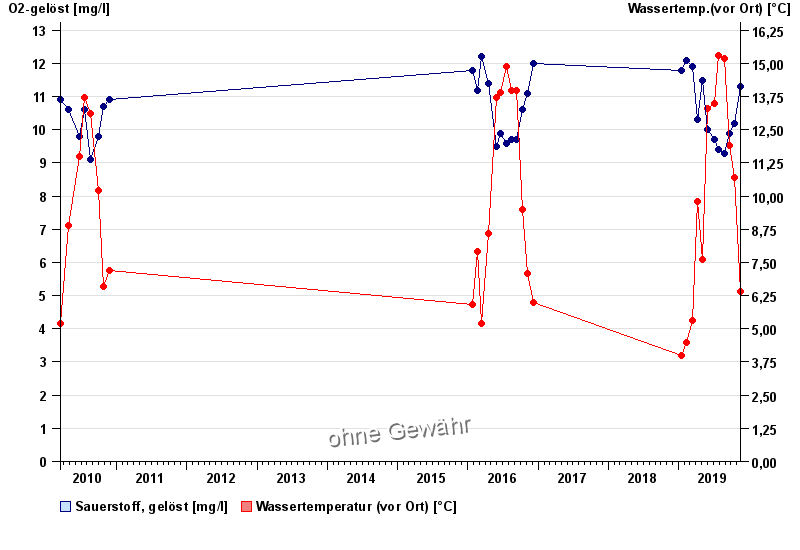
| Date | O2-gelöst [mg/l] | Wassertemp.(vor Ort) [°C] |
|---|---|---|
| 10.12.2019 | 11 | 6.5 |
| 19.11.2019 | 11.3 | 6.4 |
| 21.10.2019 | 10.2 | 10.7 |
| 23.09.2019 | 9.9 | 11.9 |
| 27.08.2019 | 9.3 | 15.2 |
| 30.07.2019 | 9.4 | 15.3 |
| 09.07.2019 | 9.7 | 13.5 |
© Bayerisches Landesamt für Umwelt 2024