
- Start >
- Rivers >
- Chemistry >
- Isar >
- Br. uh. JVA-Gebäude >
- Chart of total period

Chart of total period Br. uh. JVA-Gebäude / Neue Rott
Data from 2007-01-23 to 2016-11-28
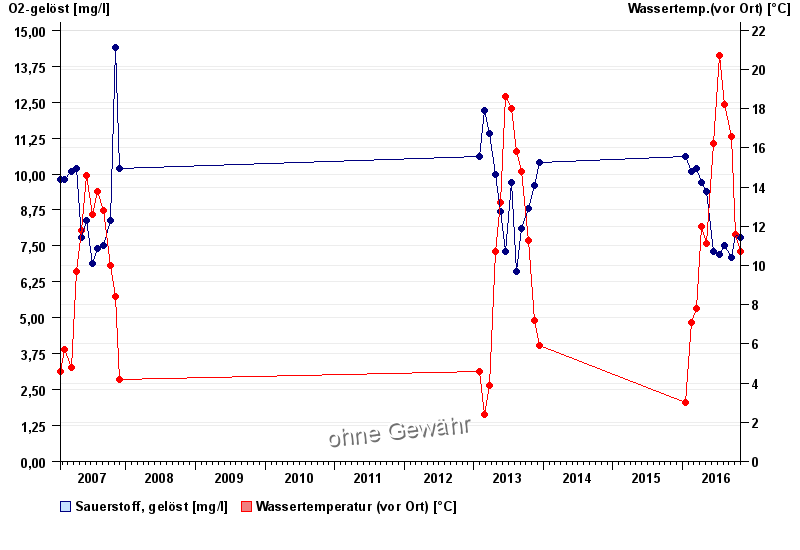
| Date | O2-gelöst [mg/l] | Wassertemp.(vor Ort) [°C] |
|---|---|---|
| 28.11.2016 | 10 | 6.2 |
| 31.10.2016 | 7.8 | 10.7 |
| 04.10.2016 | 7.9 | 11.6 |
| 14.09.2016 | 7.1 | 16.6 |
| 08.08.2016 | 7.5 | 18.2 |
| 11.07.2016 | 7.2 | 20.7 |
| 13.06.2016 | 7.3 | 16.2 |
© Bayerisches Landesamt für Umwelt 2025