

Chart of year Loderham / Altbach
Data from 2009-11-25 to 2010-11-24
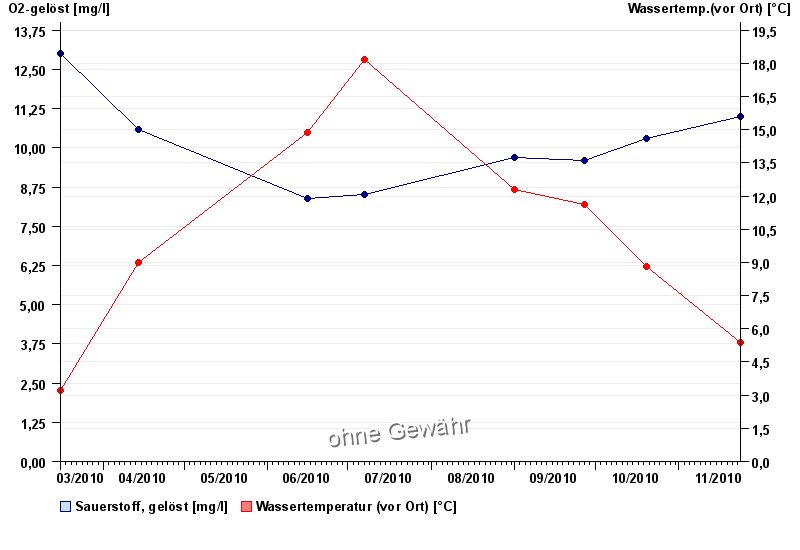
| Date | O2-gelöst [mg/l] | Wassertemp.(vor Ort) [°C] |
|---|---|---|
| 24.11.2010 | 11 | 5.4 |
| 20.10.2010 | 10.3 | 8.8 |
| 27.09.2010 | 9.6 | 11.6 |
| 01.09.2010 | 9.7 | 12.3 |
| 07.07.2010 | 8.5 | 18.2 |
| 16.06.2010 | 8.4 | 14.9 |
| 14.04.2010 | 10.6 | 9 |
© Bayerisches Landesamt für Umwelt 2024