
- Start >
- Rivers >
- Chemistry >
- Inn >
- beim Pegel Bad Berneck >
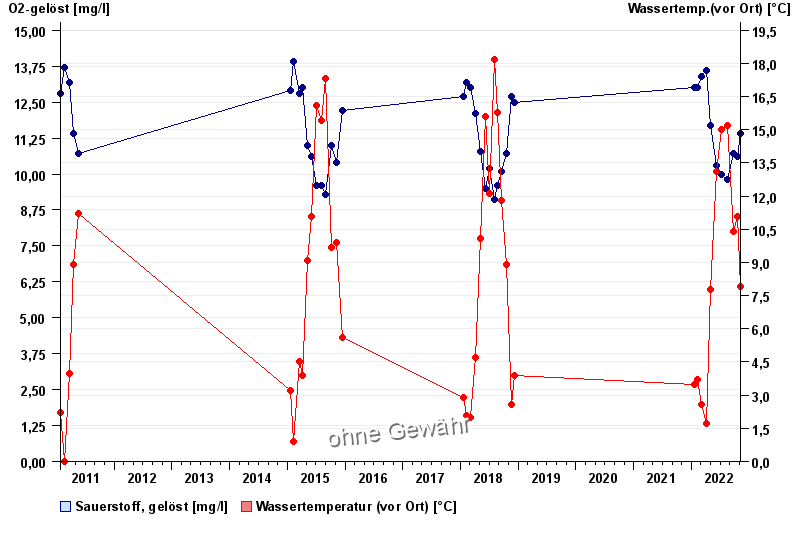
- Chart of total period

Chart of total period beim Pegel Bad Berneck / Weißer Main
Data from 2011-01-26 to 2022-12-13
| Date | O2-gelöst [mg/l] | Wassertemp.(vor Ort) [°C] |
|---|---|---|
| 13.12.2022 | 14.2 | -0.2 |
| 07.11.2022 | 11.4 | 7.9 |
| 18.10.2022 | 10.6 | 11.1 |
| 26.09.2022 | 10.7 | 10.4 |
| 17.08.2022 | 9.8 | 15.2 |
| 12.07.2022 | 10 | 15 |
| 07.06.2022 | 10.3 | 13.1 |
© Bayerisches Landesamt für Umwelt 2025