
- Start >
- Rivers >
- Chemistry >
- Bayern >
- uh. Brücke Fentbach >
- Chart of total period

Chart of total period uh. Brücke Fentbach / Moosbach
Data from 2013-04-03 to 2019-12-10
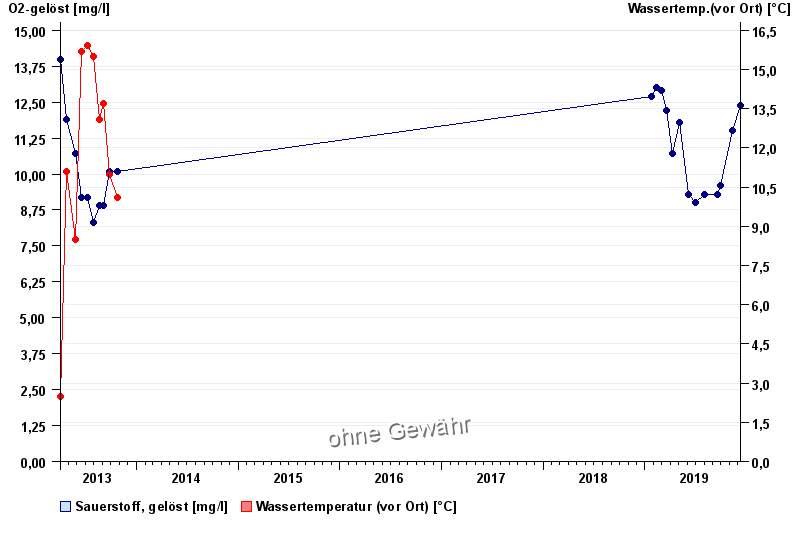
| Date | O2-gelöst [mg/l] | Wassertemp.(vor Ort) [°C] |
|---|---|---|
| 10.12.2019 | 12.4 | -- |
| 12.11.2019 | 11.5 | -- |
| 01.10.2019 | 9.6 | -- |
| 17.09.2019 | 9.3 | -- |
| 01.08.2019 | 9.3 | -- |
| 03.07.2019 | 9 | -- |
| 06.06.2019 | 9.3 | -- |
© Bayerisches Landesamt für Umwelt 2025