
- Start >
- Rivers >
- Chemistry >
- Bayern >
- Igensdorf, uh Str.br. nach Stöckach >
- Chart of total period

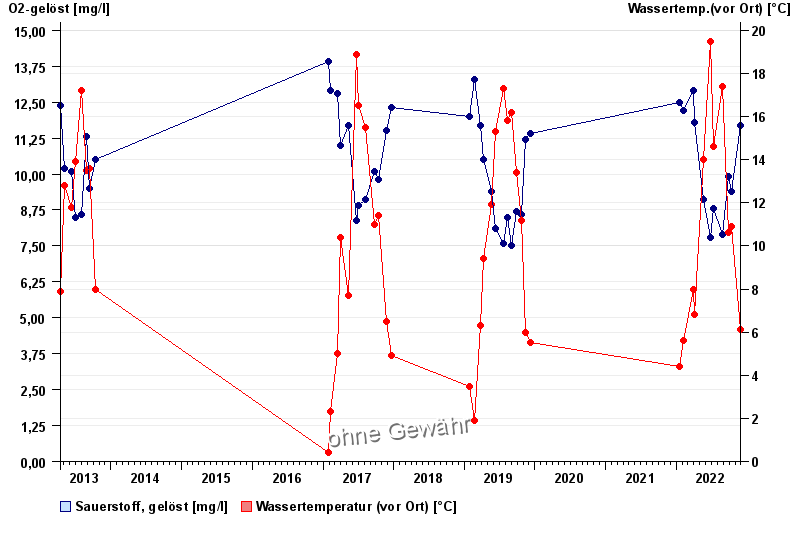
Chart of total period Igensdorf, uh Str.br. nach Stöckach / Schwabach
Data from 2013-04-15 to 2022-12-06
| Date | O2-gelöst [mg/l] | Wassertemp.(vor Ort) [°C] |
|---|---|---|
| 06.12.2022 | 11.8 | 5.4 |
| 28.11.2022 | 11.7 | 6.1 |
| 12.10.2022 | 9.4 | 10.9 |
| 28.09.2022 | 9.9 | 10.6 |
| 29.08.2022 | 7.9 | 17.4 |
| 11.07.2022 | 8.8 | 14.6 |
| 27.06.2022 | 7.8 | 19.5 |
© Bayerisches Landesamt für Umwelt 2025