
- Start >
- Rivers >
- Chemistry >
- Bayern >
- FURT OH AU >
- Chart of year

Chart of year FURT OH AU / Waldnaab
Data from 2020-01-01 to 2020-12-07
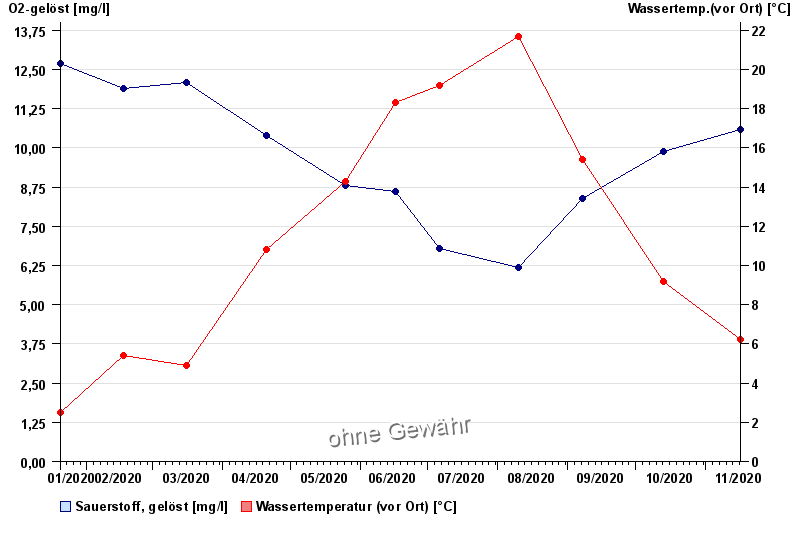
| Date | O2-gelöst [mg/l] | Wassertemp.(vor Ort) [°C] |
|---|---|---|
| 07.12.2020 | 12 | 2.6 |
| 16.11.2020 | 10.6 | 6.2 |
| 13.10.2020 | 9.9 | 9.2 |
| 07.09.2020 | 8.4 | 15.4 |
| 10.08.2020 | 6.2 | 21.7 |
| 06.07.2020 | 6.8 | 19.2 |
| 16.06.2020 | 8.6 | 18.3 |
© Bayerisches Landesamt für Umwelt 2026