
- Start >
- Rivers >
- Chemistry >
- Bayern >
- Dillingen Meßstation >
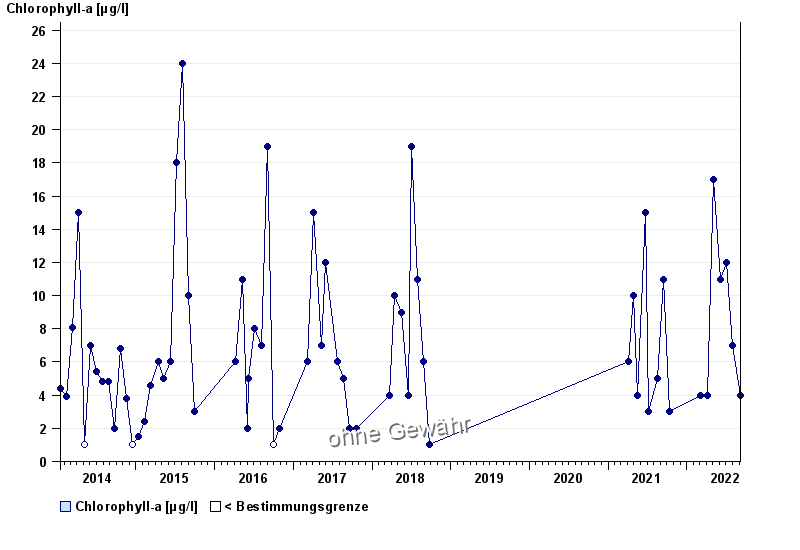
- Chart of total period

Chart of total period Dillingen Meßstation / Donau
Data from 2014-01-15 to 2022-10-11
| Date | Chlorophyll-a [µg/l] |
|---|---|
| 11.10.2022 | 2 |
| 07.09.2022 | 4 |
| 03.08.2022 | 7 |
| 05.07.2022 | 12 |
| 08.06.2022 | 11 |
| 03.05.2022 | 17 |
| 06.04.2022 | 4 |
© Bayerisches Landesamt für Umwelt 2026