
- Start >
- Meteorology >
- Wind >
- Unterer Main >
- Bischbrunn >
- Chart of total period

Chart of total period Bischbrunn
Wind from 06.05.2011 to 28.04.2024
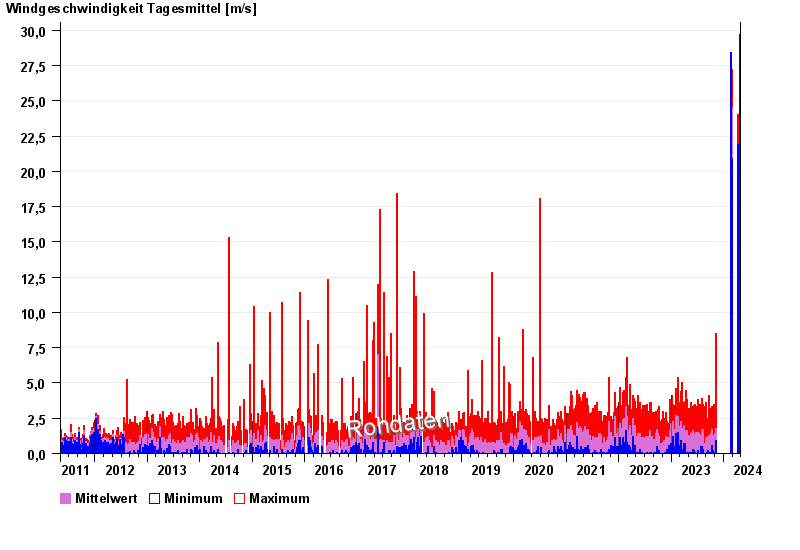
Note: The time series in the selected period has gaps.
| Date | Mean value [m/s] | Maximum [m/s] | Minimum [m/s] |
|---|---|---|---|
| 28.04.2024 | 13.7 | 13.7 | 13.7 |
| 27.04.2024 | 12.8 | 19.4 | 5.8 |
| 26.04.2024 | 19.0 | 19.0 | 19.0 |
| 23.04.2024 | 6.3 | 6.3 | 6.3 |
| 21.04.2024 | 29.7 | 29.7 | 29.7 |
| 18.04.2024 | 0.0 | 0.0 | 0.0 |
| 11.04.2024 | 19.4 | 24.0 | 14.7 |
© Bayerisches Landesamt für Umwelt 2024