
- Start >
- Meteorology >
- Wind >
- Bayern >
- Sandharlanden >
- Chart of total period

Chart of total period Sandharlanden
Wind from 21.02.1999 to 28.04.2024
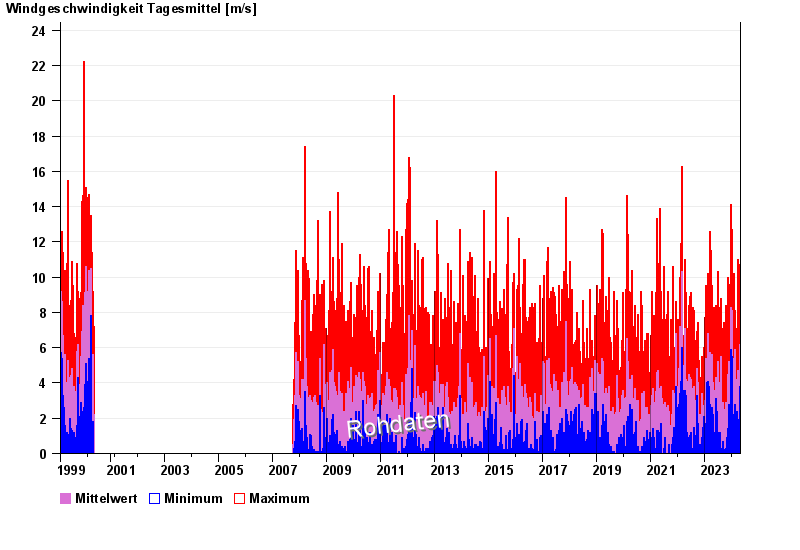
Note: The time series in the selected period has gaps.
| Date | Mean value [m/s] | Maximum [m/s] | Minimum [m/s] |
|---|---|---|---|
| 28.04.2024 | 1.1 | 2.4 | 0.5 |
| 27.04.2024 | 2.3 | 5.0 | 0.0 |
| 26.04.2024 | 1.5 | 4.0 | 0.0 |
| 25.04.2024 | 2.3 | 5.9 | 0.0 |
| 24.04.2024 | 2.9 | 6.5 | 0.0 |
| 23.04.2024 | 2.9 | 4.5 | 0.3 |
| 22.04.2024 | 3.7 | 4.5 | 2.8 |
© Bayerisches Landesamt für Umwelt 2024