
- Start >
- Meteorology >
- Precipitation >
- Obere Donau >
- Hepberg >
- Chart of total period

Chart of total period Hepberg
Precipitation from 26.06.1994 to 20.01.2022
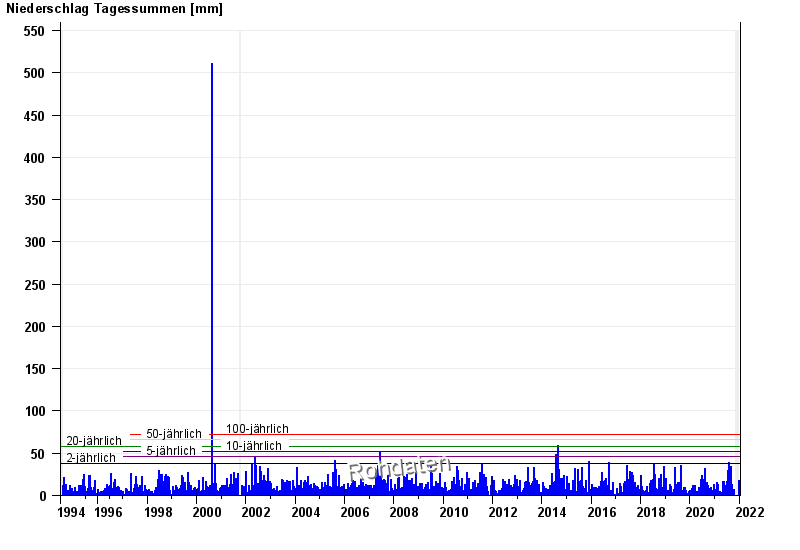
Note: The time series in the selected period has gaps.
| Date | Precipitation [mm] |
|---|---|
| 20.01.2022 | 1.3 |
| 19.01.2022 | 0.0 |
| 18.01.2022 | 0.2 |
| 17.01.2022 | 0.1 |
| 16.01.2022 | 0.0 |
| 15.01.2022 | 0.0 |
| 14.01.2022 | 0.0 |
© Bayerisches Landesamt für Umwelt 2026