
- Start >
- Meteorology >
- Precipitation >
- Inn >
- Nilling >
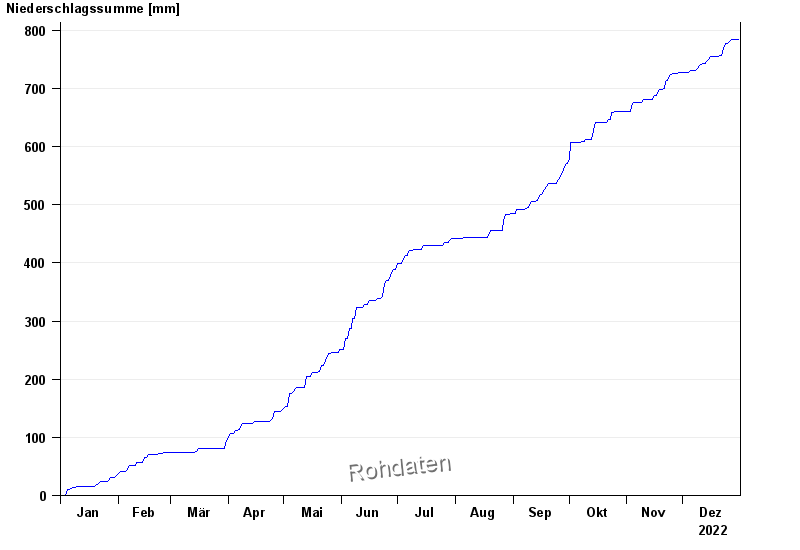
- Chart of year

Chart of year Nilling
Precipitation from 01.01.2022 to 31.12.2022
| Sum [mm] in the selected period | Mean [mm] 1961-1990 in the selected period |
| Date | Precipitation [mm] |
|---|---|
| 31.12.2022 | 0.1 |
| 30.12.2022 | 0.1 |
| 29.12.2022 | 0.0 |
| 28.12.2022 | 0.0 |
| 27.12.2022 | 2.6 |
| 26.12.2022 | 4.2 |
| 25.12.2022 | 0.1 |
© Bayerisches Landesamt für Umwelt 2024