
- Start >
- Meteorology >
- Precipitation >
- Bayern >
- Hepberg >
- Chart of year

Chart of year Hepberg
Precipitation from 01.01.2021 to 31.12.2021
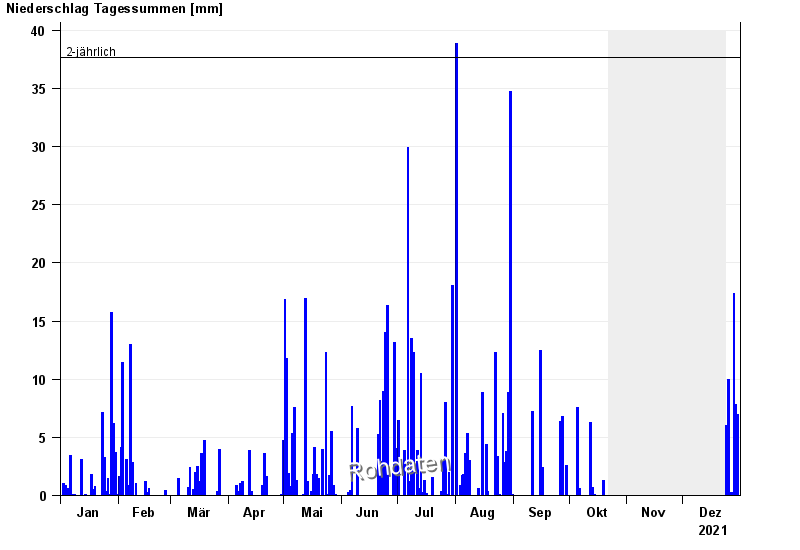
Note: The time series in the selected period has gaps.
| Sum [mm] in the selected period | Mean [mm] 1961-1990 in the selected period |
| Date | Precipitation [mm] |
|---|---|
| 31.12.2021 | 0.0 |
| 30.12.2021 | 7.0 |
| 29.12.2021 | 7.8 |
| 28.12.2021 | 17.4 |
| 27.12.2021 | 0.3 |
| 26.12.2021 | 0.3 |
| 25.12.2021 | 10.0 |
© Bayerisches Landesamt für Umwelt 2025