
- Start >
- Meteorology >
- Global radiation >
- Untere Donau >
- Kirchberg >
- Chart of total period

Chart of total period Kirchberg
Global radiation from 06.11.2009 to 15.12.2025
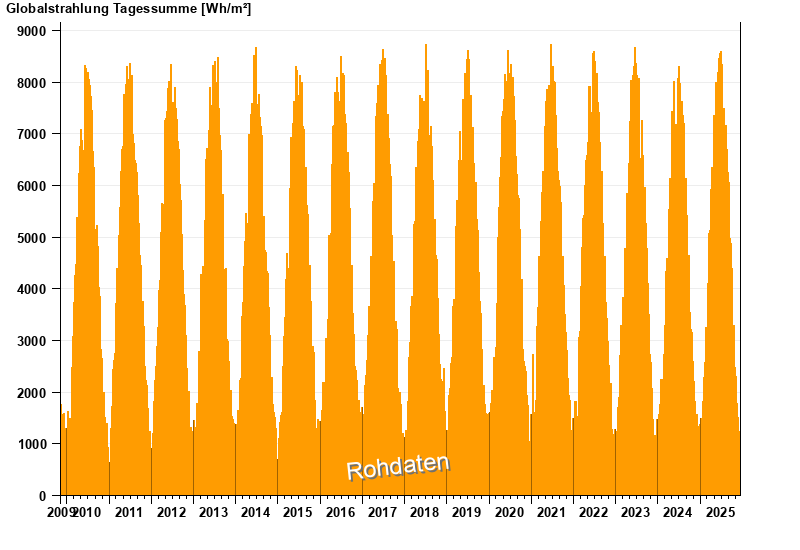
Note: The time series in the selected period has gaps.
| Date | Global radiation [Wh/m²] |
|---|---|
| 15.12.2025 | 1076.7 |
| 14.12.2025 | 417.5 |
| 13.12.2025 | 471.3 |
| 12.12.2025 | 744.0 |
| 11.12.2025 | 508.4 |
| 10.12.2025 | 1109.7 |
| 09.12.2025 | 696.3 |
© Bayerisches Landesamt für Umwelt 2025