
- Start >
- Meteorology >
- Global radiation >
- Untere Donau >
- Engersdorf >
- Chart of year

Chart of year Engersdorf
Global radiation from 30.05.2023 to 29.05.2024
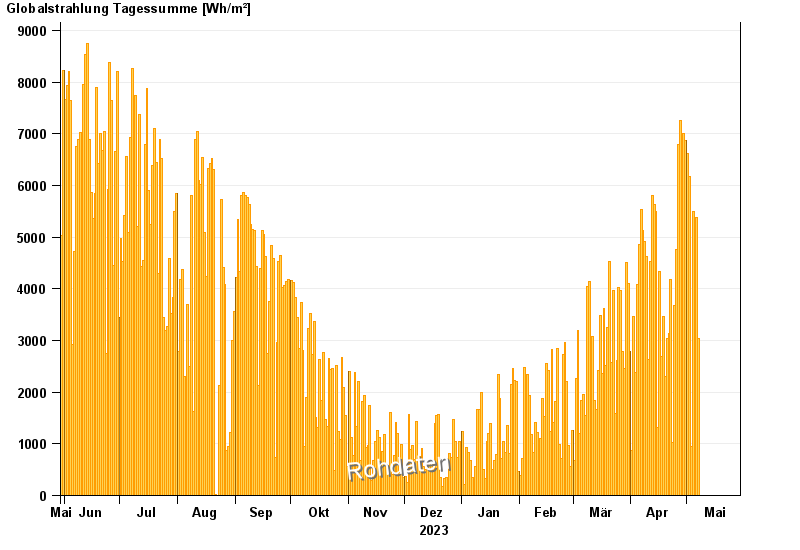
Note: The time series in the selected period has gaps.
| Date | Global radiation [Wh/m²] |
|---|---|
| 29.05.2024 | 6695.8 |
| 28.05.2024 | 3467.9 |
| 27.05.2024 | 5472.3 |
| 26.05.2024 | 7349.6 |
| 25.05.2024 | 4419.0 |
| 24.05.2024 | 5765.3 |
| 23.05.2024 | 6038.2 |
© Bayerisches Landesamt für Umwelt 2024