
- Start >
- Meteorology >
- Global radiation >
- Untere Donau >
- Engersdorf >
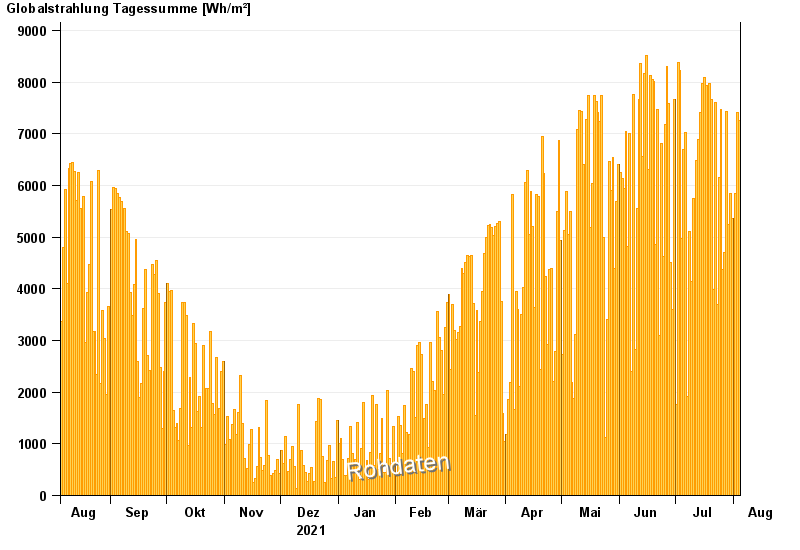
- Chart of year

Chart of year Engersdorf
Global radiation from 05.08.2021 to 04.08.2022
| Date | Global radiation [Wh/m²] |
|---|---|
| 04.08.2022 | 7257.9 |
| 03.08.2022 | 7403.5 |
| 02.08.2022 | 5836.4 |
| 01.08.2022 | 5222.8 |
| 31.07.2022 | 5365.8 |
| 30.07.2022 | 5852.8 |
| 29.07.2022 | 5250.7 |
© Bayerisches Landesamt für Umwelt 2024