
- Start >
- Meteorology >
- Global radiation >
- Naab - Regen >
- Sitzenhof >
- Chart of total period

Chart of total period Sitzenhof
Global radiation from 31.07.1994 to 08.12.2025
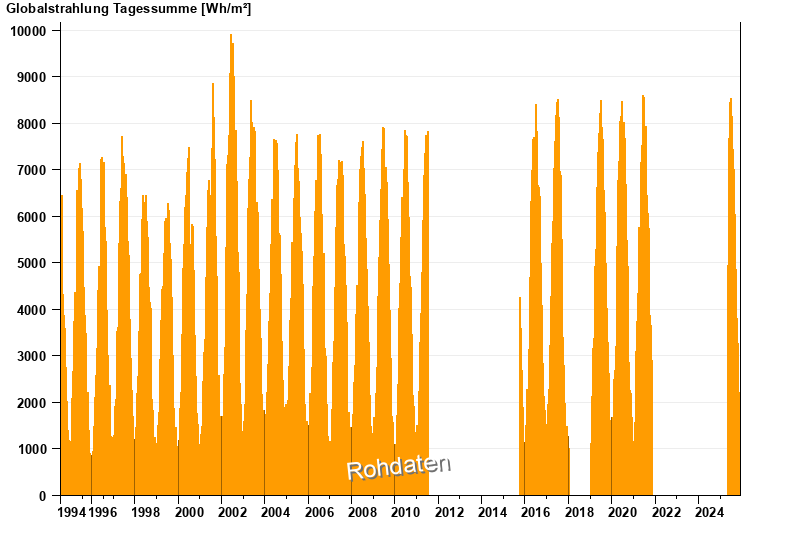
Note: The time series in the selected period has gaps.
note
Derzeit nicht verfügbar
| Date | Global radiation [Wh/m²] |
|---|---|
| 08.12.2025 | 626.8 |
| 07.12.2025 | 397.3 |
| 06.12.2025 | 279.8 |
| 05.12.2025 | 368.4 |
| 04.12.2025 | 260.7 |
| 03.12.2025 | 232.3 |
| 02.12.2025 | 432.7 |
© Bayerisches Landesamt für Umwelt 2025