
- Start >
- Meteorology >
- Global radiation >
- Naab - Regen >
- Pfrentsch >
- Chart of total period

Chart of total period Pfrentsch
Global radiation from 13.05.2020 to 29.04.2024
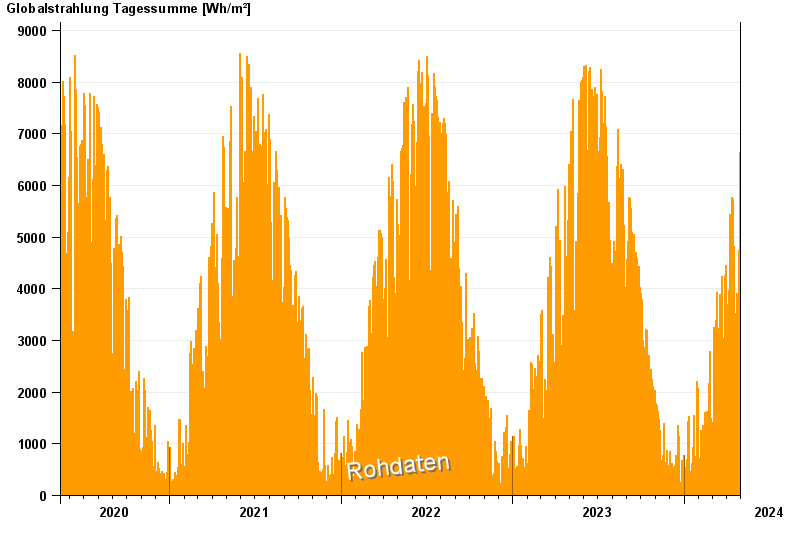
Note: The time series in the selected period has gaps.
| Date | Global radiation [Wh/m²] |
|---|---|
| 29.04.2024 | 6832.1 |
| 28.04.2024 | 5117.8 |
| 27.04.2024 | 6643.7 |
| 26.04.2024 | 4733.1 |
| 25.04.2024 | 3688.8 |
| 24.04.2024 | 3657.5 |
| 23.04.2024 | 2606.1 |
© Bayerisches Landesamt für Umwelt 2024