
- Start >
- Meteorology >
- Global radiation >
- Naab - Regen >
- Asen >
- Chart of total period

Chart of total period Asen
Global radiation from 27.07.1994 to 10.04.2024
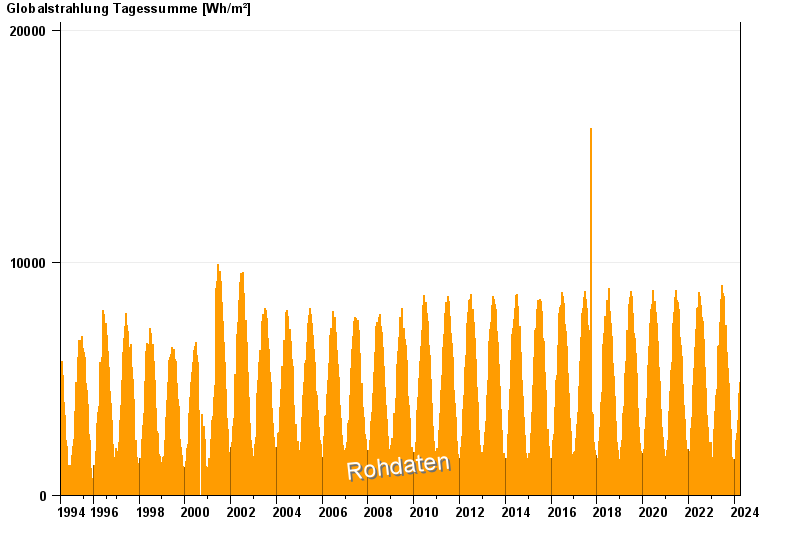
Note: The time series in the selected period has gaps.
| Date | Global radiation [Wh/m²] |
|---|---|
| 10.04.2024 | 3467.9 |
| 09.04.2024 | 3129.1 |
| 08.04.2024 | 5154.1 |
| 07.04.2024 | 5183.3 |
| 06.04.2024 | 5746.2 |
| 05.04.2024 | 4952.5 |
| 04.04.2024 | 3641.5 |
© Bayerisches Landesamt für Umwelt 2024