
- Start >
- Meteorology >
- Global radiation >
- Unterer Main >
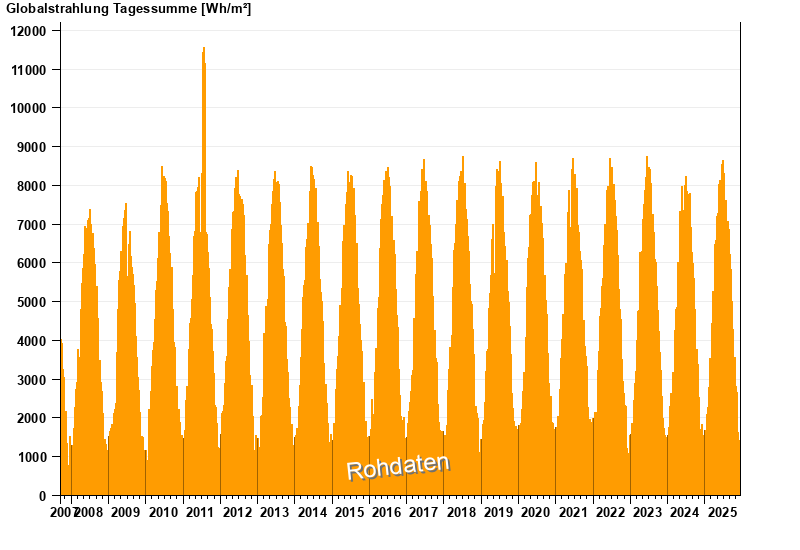
- Rotthalmünster >
- Chart of total period

Chart of total period Rotthalmünster
Global radiation from 18.09.2007 to 15.12.2025
Note: The time series in the selected period has gaps.
| Date | Global radiation [Wh/m²] |
|---|---|
| 15.12.2025 | 283.6 |
| 14.12.2025 | 230.2 |
| 13.12.2025 | 291.7 |
| 12.12.2025 | 298.1 |
| 11.12.2025 | 242.7 |
| 10.12.2025 | 779.5 |
| 09.12.2025 | 1121.7 |
© Bayerisches Landesamt für Umwelt 2025