
- Start >
- Meteorology >
- Global radiation >
- Unterer Main >
- Hohenroth >
- Chart of total period

Chart of total period Hohenroth
Global radiation from 06.08.1994 to 05.05.2024
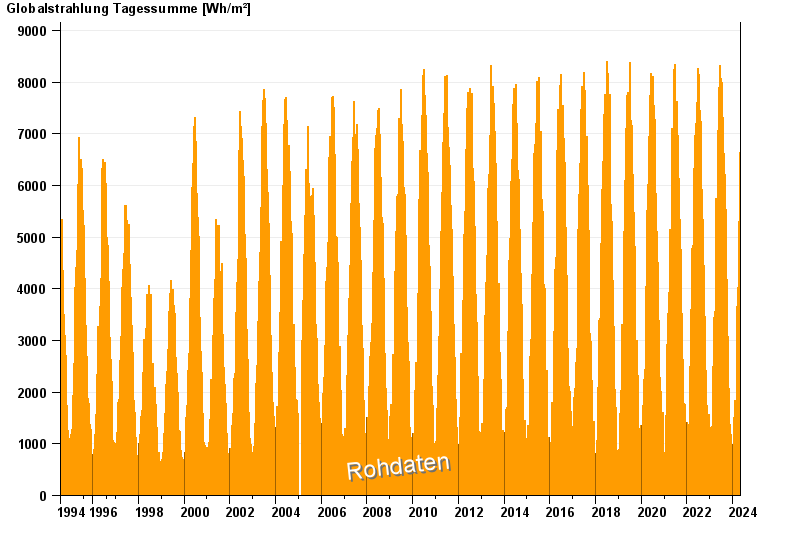
Note: The time series in the selected period has gaps.
| Date | Global radiation [Wh/m²] |
|---|---|
| 05.05.2024 | 2725.6 |
| 04.05.2024 | 3500.1 |
| 03.05.2024 | 2400.6 |
| 02.05.2024 | 4987.2 |
| 01.05.2024 | 5871.2 |
| 30.04.2024 | 6526.2 |
| 29.04.2024 | 5885.0 |
© Bayerisches Landesamt für Umwelt 2024