
- Start >
- Meteorology >
- Global radiation >
- Unterer Main >
- Frankenhofen >
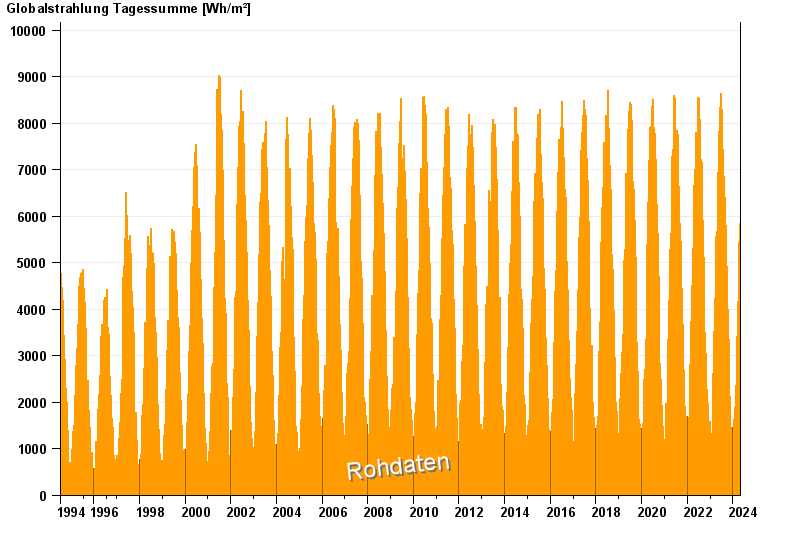
- Chart of total period

Chart of total period Frankenhofen
Global radiation from 19.07.1994 to 01.05.2024
Note: The time series in the selected period has gaps.
| Date | Global radiation [Wh/m²] |
|---|---|
| 01.05.2024 | 2859.0 |
| 30.04.2024 | 6423.8 |
| 29.04.2024 | 5968.4 |
| 28.04.2024 | 5290.3 |
| 27.04.2024 | 7062.8 |
| 26.04.2024 | 4278.3 |
| 25.04.2024 | 4461.0 |
© Bayerisches Landesamt für Umwelt 2024