
- Start >
- Meteorology >
- Global radiation >
- Obere Donau >
- Heilsbronn_Aich >
- Chart of total period

Chart of total period Heilsbronn_Aich
Global radiation from 02.07.1994 to 08.05.2024
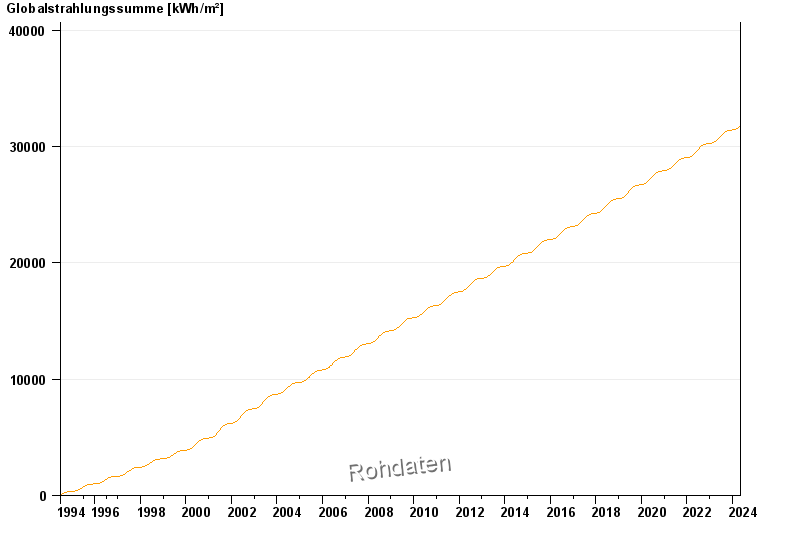
Note: The time series in the selected period has gaps.
| Date | Global radiation [Wh/m²] |
|---|---|
| 08.05.2024 | 1706.6 |
| 07.05.2024 | 1468.4 |
| 06.05.2024 | 3260.7 |
| 05.05.2024 | 3467.9 |
| 04.05.2024 | 4788.9 |
| 03.05.2024 | 2578.1 |
| 02.05.2024 | 4932.5 |
© Bayerisches Landesamt für Umwelt 2024