
- Start >
- Meteorology >
- Global radiation >
- Obere Donau >
- Eschenhart >
- Chart of total period

Chart of total period Eschenhart
Global radiation from 10.09.1994 to 08.07.2019
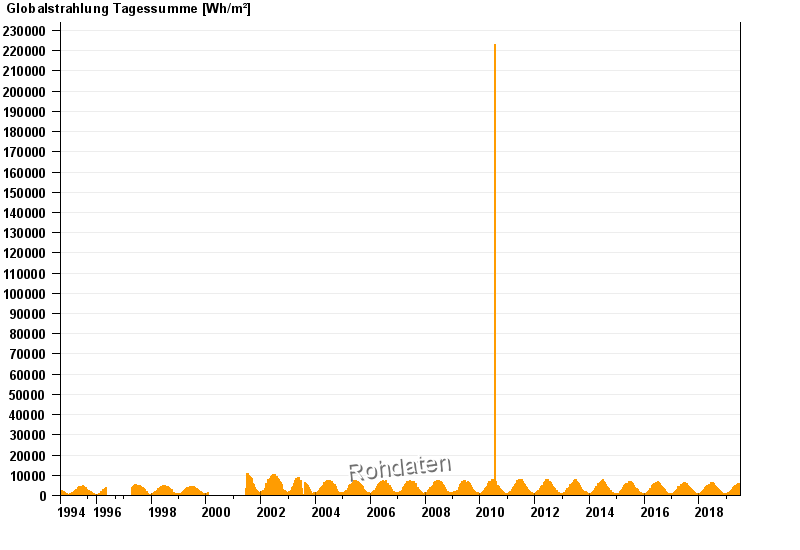
Note: The time series in the selected period has gaps.
| Date | Global radiation [Wh/m²] |
|---|---|
| 08.07.2019 | 141.8 |
| 07.07.2019 | 2171.7 |
| 06.07.2019 | 5094.3 |
| 05.07.2019 | 4274.3 |
| 04.07.2019 | 5927.2 |
| 03.07.2019 | 5812.5 |
| 02.07.2019 | 5592.7 |
© Bayerisches Landesamt für Umwelt 2026