
- Start >
- Meteorology >
- Global radiation >
- Isar >
- Nilling >
- Chart of year

Chart of year Nilling
Global radiation from 20.09.2017 to 19.09.2018
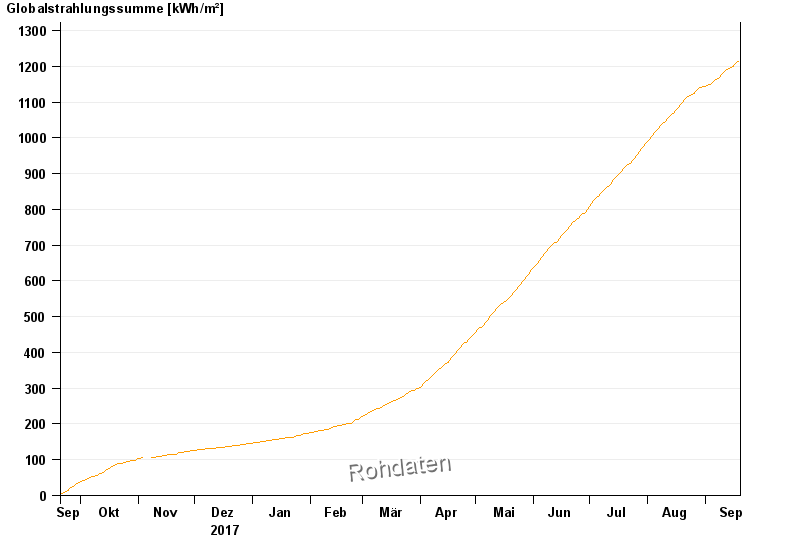
Note: The time series in the selected period has gaps.
| Date | Global radiation [Wh/m²] |
|---|---|
| 19.09.2018 | 4240.0 |
| 18.09.2018 | 4462.1 |
| 17.09.2018 | 4542.9 |
| 16.09.2018 | 4740.8 |
| 15.09.2018 | 2630.0 |
| 14.09.2018 | 1660.1 |
| 13.09.2018 | 4400.5 |
© Bayerisches Landesamt für Umwelt 2024