
- Start >
- Meteorology >
- Global radiation >
- Isar >
- Landsberg >
- Chart of total period

Chart of total period Landsberg
Global radiation from 06.07.1994 to 02.11.2023
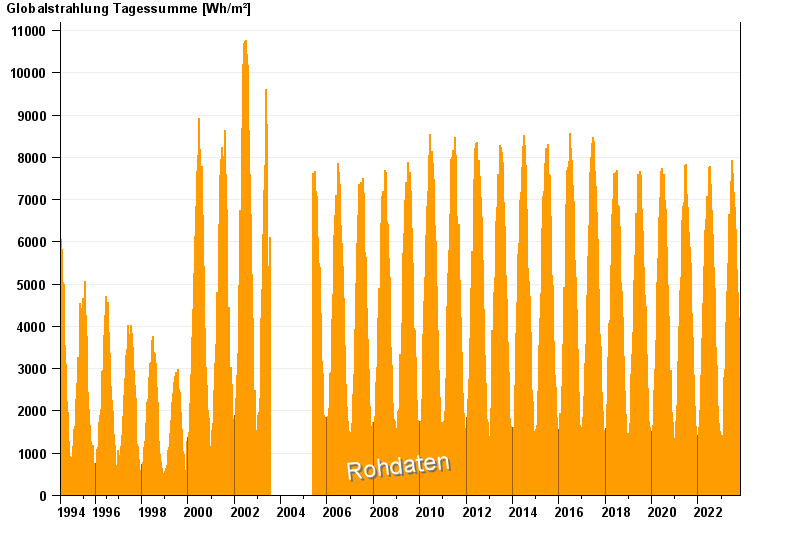
Note: The time series in the selected period has gaps.
Verlagerung
Station im Herbst 2023 abgebaut, neuer Standort geplant
| Date | Global radiation [Wh/m²] |
|---|---|
| 02.11.2023 | 539.8 |
| 01.11.2023 | 2309.8 |
| 31.10.2023 | 1160.1 |
| 30.10.2023 | 1111.7 |
| 29.10.2023 | 1638.3 |
| 28.10.2023 | 2336.2 |
| 27.10.2023 | 1727.0 |
© Bayerisches Landesamt für Umwelt 2024