
- Start >
- Meteorology >
- Global radiation >
- Isar >
- Birkenmoor >
- Chart of total period

Chart of total period Birkenmoor
Global radiation from 13.08.1994 to 07.05.2024
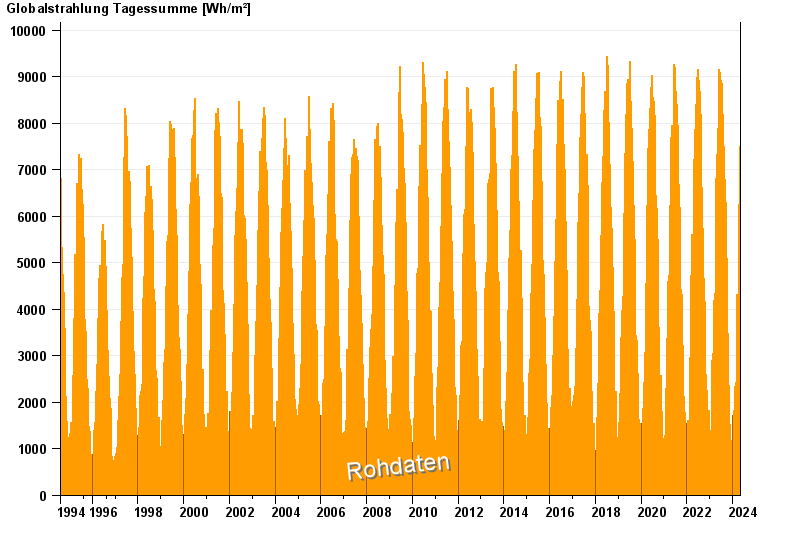
Note: The time series in the selected period has gaps.
| Date | Global radiation [Wh/m²] |
|---|---|
| 07.05.2024 | 35.5 |
| 06.05.2024 | 2834.9 |
| 05.05.2024 | 4086.6 |
| 04.05.2024 | 3884.6 |
| 03.05.2024 | 1869.4 |
| 02.05.2024 | 6285.2 |
| 01.05.2024 | 7199.0 |
© Bayerisches Landesamt für Umwelt 2024