
- Start >
- Meteorology >
- Global radiation >
- Inn >
- Forsting >
- Chart of total period

Chart of total period Forsting
Global radiation from 16.07.1994 to 02.05.2024
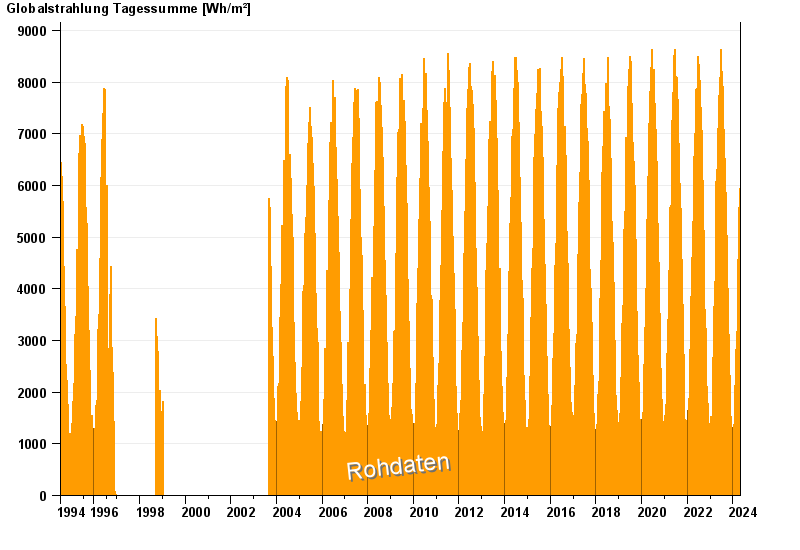
Note: The time series in the selected period has gaps.
| Date | Global radiation [Wh/m²] |
|---|---|
| 02.05.2024 | 5907.1 |
| 01.05.2024 | 6317.9 |
| 30.04.2024 | 6824.7 |
| 29.04.2024 | 6884.6 |
| 28.04.2024 | 5755.2 |
| 27.04.2024 | 7103.0 |
| 26.04.2024 | 6434.8 |
© Bayerisches Landesamt für Umwelt 2024