
- Start >
- Meteorology >
- Global radiation >
- Iller - Lech - Bodensee >
- Neuhof >
- Chart of total period

Chart of total period Neuhof
Global radiation from 01.09.1993 to 26.10.2021
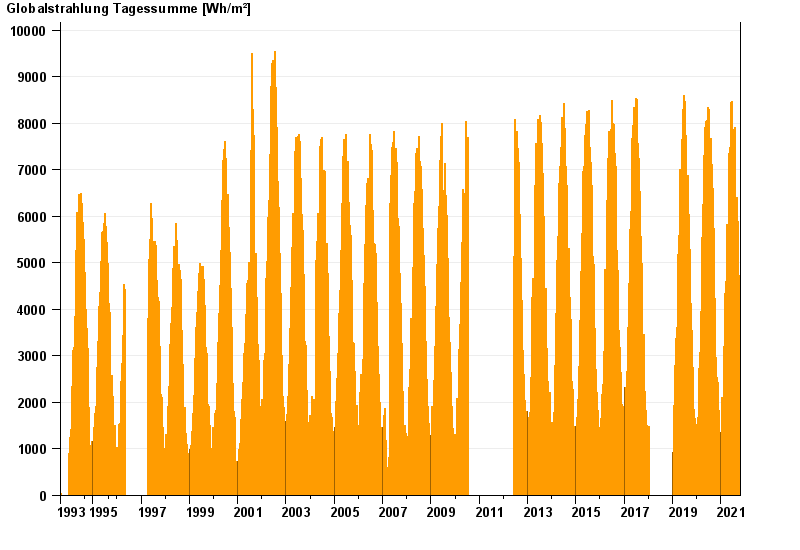
Note: The time series in the selected period has gaps.
| Date | Global radiation [Wh/m²] |
|---|---|
| 26.10.2021 | 1680.5 |
| 25.10.2021 | 1928.0 |
| 24.10.2021 | 3162.7 |
| 23.10.2021 | 2383.7 |
| 22.10.2021 | 3010.3 |
| 21.10.2021 | 2326.7 |
| 20.10.2021 | 2623.5 |
© Bayerisches Landesamt für Umwelt 2024