
- Start >
- Meteorology >
- Global radiation >
- Bayern >
- Sommerach >
- Chart of total period

Chart of total period Sommerach
Global radiation from 23.08.1994 to 30.03.2010
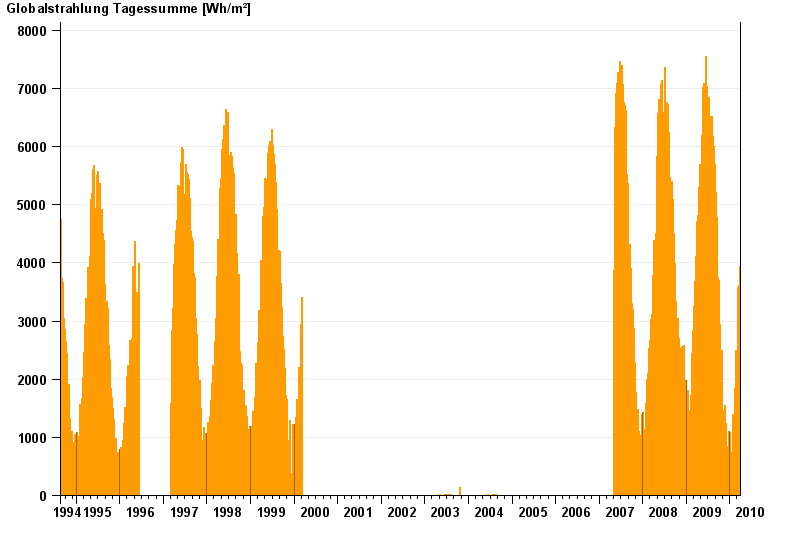
Note: The time series in the selected period has gaps.
| Date | Global radiation [Wh/m²] |
|---|---|
| 30.03.2010 | 1.1 |
| 29.03.2010 | 1996.7 |
| 28.03.2010 | 2411.7 |
| 27.03.2010 | 2058.2 |
| 26.03.2010 | 3268.5 |
| 25.03.2010 | 3883.8 |
| 24.03.2010 | 3942.8 |
© Bayerisches Landesamt für Umwelt 2026