
- Start >
- Meteorology >
- Global radiation >
- Bayern >
- Rotthalmünster >
- Chart of total period

Chart of total period Rotthalmünster
Global radiation from 18.09.2007 to 06.05.2024
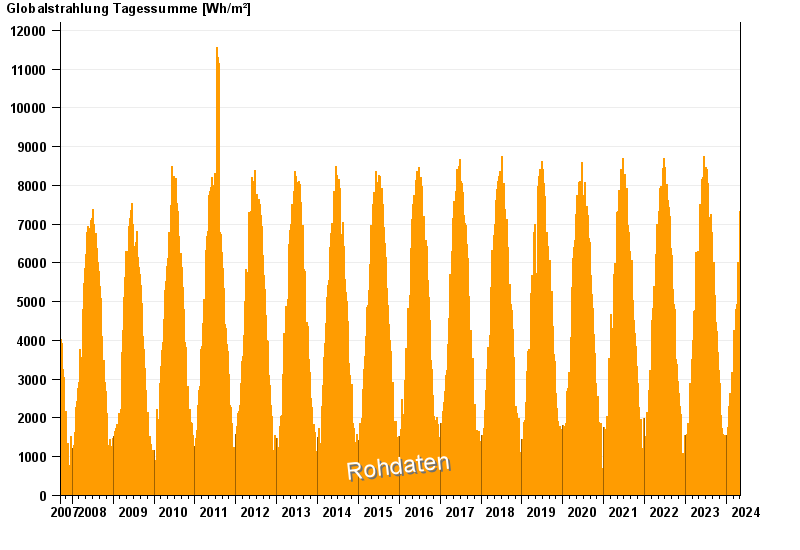
Note: The time series in the selected period has gaps.
| Date | Global radiation [Wh/m²] |
|---|---|
| 06.05.2024 | 5911.8 |
| 05.05.2024 | 6557.5 |
| 04.05.2024 | 6501.1 |
| 03.05.2024 | 1052.8 |
| 02.05.2024 | 6214.2 |
| 01.05.2024 | 6894.0 |
| 30.04.2024 | 6759.7 |
© Bayerisches Landesamt für Umwelt 2024