
- Start >
- Meteorology >
- Global radiation >
- Bayern >
- Obersteinbach >
- Chart of year

Chart of year Obersteinbach
Global radiation from 01.01.2010 to 17.07.2010
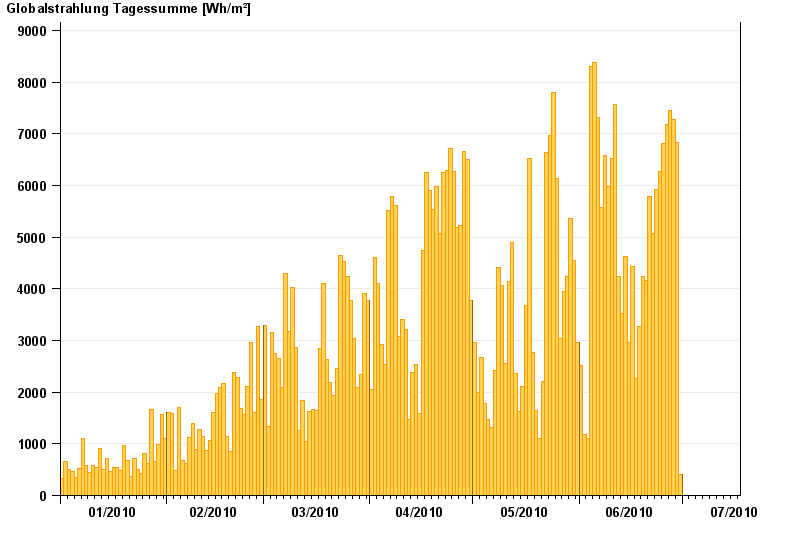
Note: The time series in the selected period has gaps.
| Date | Global radiation [Wh/m²] |
|---|---|
| 17.07.2010 | 0.7 |
| 16.07.2010 | 2.2 |
| 15.07.2010 | 2.2 |
| 14.07.2010 | 2.2 |
| 30.06.2010 | 410.4 |
| 29.06.2010 | 6830.1 |
| 28.06.2010 | 7281.3 |
© Bayerisches Landesamt für Umwelt 2026