
- Start >
- Meteorology >
- Global radiation >
- Bayern >
- Gaibach-Kapellenberg >
- Chart of total period

Chart of total period Gaibach-Kapellenberg
Global radiation from 17.07.2012 to 15.12.2025
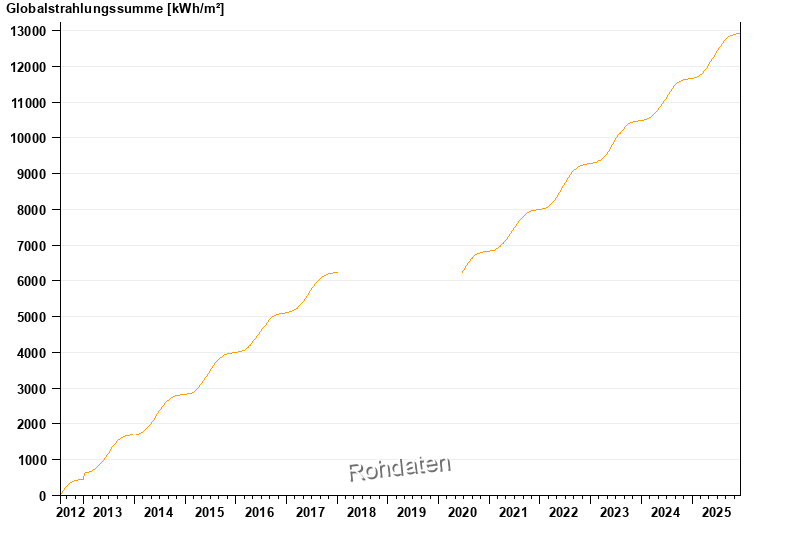
Note: The time series in the selected period has gaps.
| Date | Global radiation [Wh/m²] |
|---|---|
| 15.12.2025 | 394.1 |
| 14.12.2025 | 299.5 |
| 13.12.2025 | 190.0 |
| 12.12.2025 | 279.7 |
| 11.12.2025 | 1011.4 |
| 10.12.2025 | 323.4 |
| 09.12.2025 | 1415.1 |
© Bayerisches Landesamt für Umwelt 2025