
- Start >
- Meteorology >
- Global radiation >
- Bayern >
- Ettleben >
- Chart of year

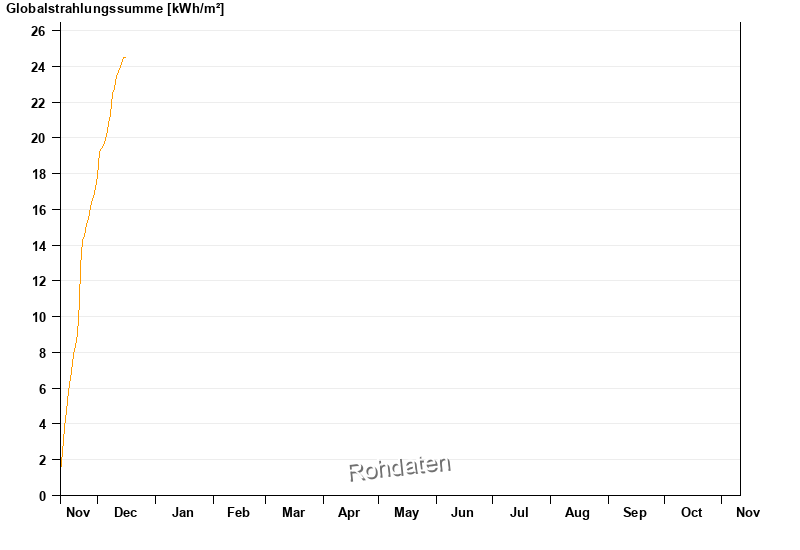
Chart of year Ettleben
Global radiation from 11.11.2025 to 10.11.2026
| Date | Global radiation [Wh/m²] |
|---|---|
| 15.12.2025 | 308.0 |
| 14.12.2025 | 255.9 |
| 13.12.2025 | 206.9 |
| 12.12.2025 | 261.2 |
| 11.12.2025 | 697.0 |
| 10.12.2025 | 286.6 |
| 09.12.2025 | 1138.4 |
© Bayerisches Landesamt für Umwelt 2025