
- Start >
- Meteorology >
- Global radiation >
- Bayern >
- Aldersbach >
- Chart of total period

Chart of total period Aldersbach
Global radiation from 30.04.2015 to 15.12.2025
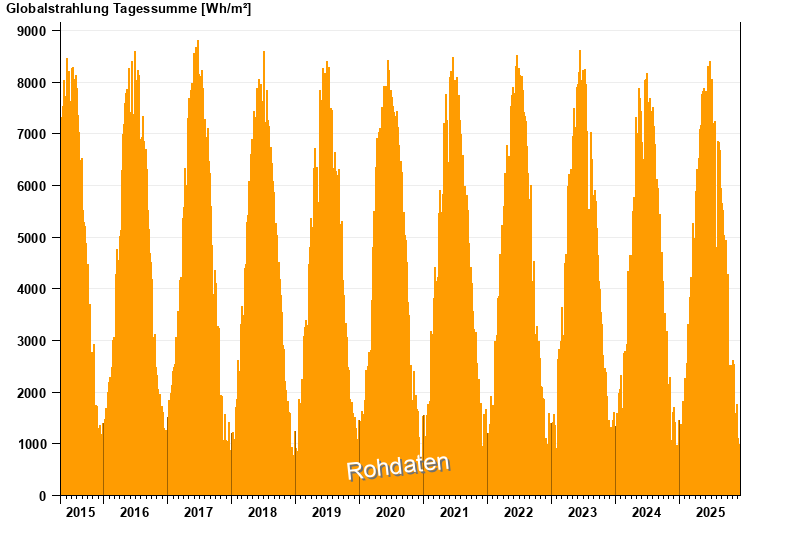
Note: The time series in the selected period has gaps.
| Date | Global radiation [Wh/m²] |
|---|---|
| 15.12.2025 | 269.0 |
| 14.12.2025 | 190.1 |
| 13.12.2025 | 193.7 |
| 12.12.2025 | 213.9 |
| 11.12.2025 | 339.5 |
| 10.12.2025 | 637.8 |
| 09.12.2025 | 994.0 |
© Bayerisches Landesamt für Umwelt 2025