
- Start >
- Meteorology >
- Air temperature >
- Iller - Lech - Bodensee >
- Schwabmünchen >
- Chart of total period

Chart of total period Schwabmünchen
Air temperatur from 18.04.1997 to 08.05.2024
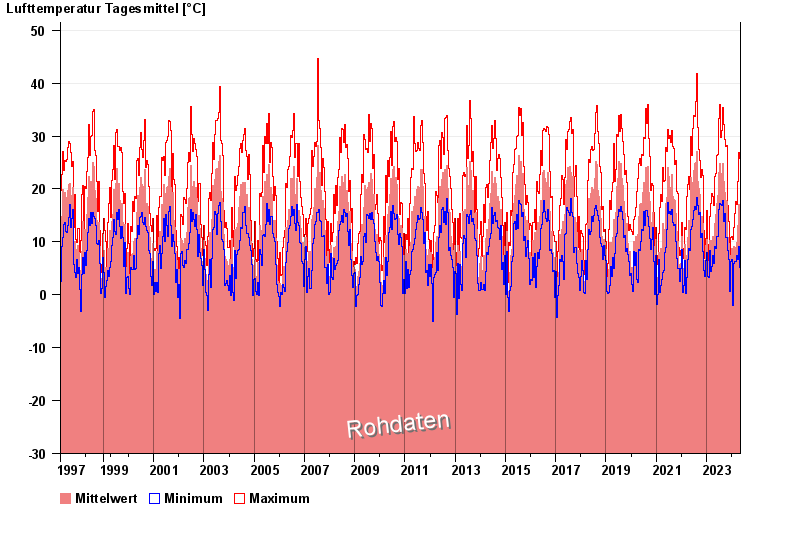
Note: The time series in the selected period has gaps.
| Date | Mean value [°C] | Maximum [°C] | Minimum [°C] |
|---|---|---|---|
| 08.05.2024 | 9.4 | 10.1 | 9.0 |
| 07.05.2024 | 12.3 | 16.2 | 9.4 |
| 06.05.2024 | 13.0 | 20.5 | 6.9 |
| 05.05.2024 | 13.6 | 21.3 | 7.6 |
| 04.05.2024 | 12.6 | 20.6 | 3.8 |
| 03.05.2024 | 10.4 | 12.4 | 8.6 |
| 02.05.2024 | 13.1 | 20.4 | 7.4 |
© Bayerisches Landesamt für Umwelt 2024