
- Start >
- Meteorology >
- Air temperature >
- Bayern >
- Fahrenberg >
- Chart of total period

Chart of total period Fahrenberg
Air temperatur from 13.09.2019 to 30.04.2024
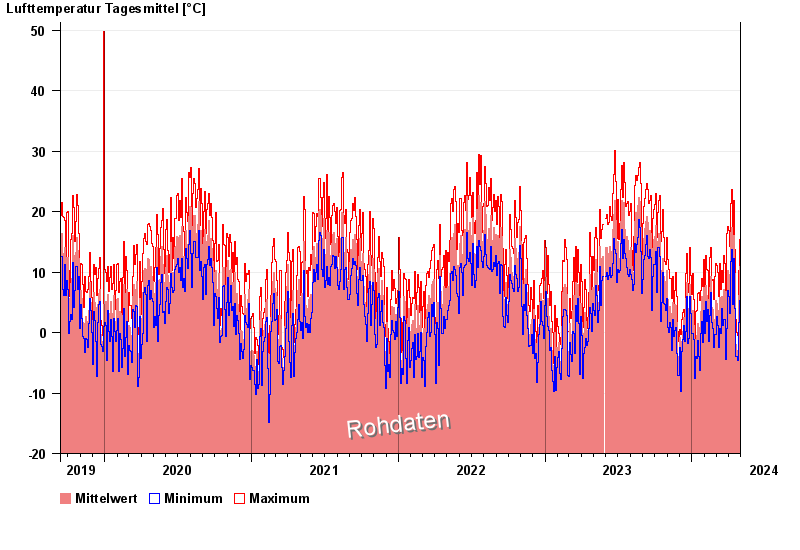
Note: The time series in the selected period has gaps.
| Date | Mean value [°C] | Maximum [°C] | Minimum [°C] |
|---|---|---|---|
| 30.04.2024 | 14.5 | 20.7 | 10.0 |
| 29.04.2024 | 10.9 | 15.4 | 5.3 |
| 28.04.2024 | 8.8 | 13.6 | 4.7 |
| 27.04.2024 | 6.1 | 10.2 | 1.7 |
| 26.04.2024 | 2.5 | 7.5 | -3.0 |
| 25.04.2024 | -2.6 | 0.2 | -5.5 |
| 24.04.2024 | -3.3 | -0.5 | -4.7 |
© Bayerisches Landesamt für Umwelt 2024