
- Start >
- Meteorology >
- Air pressure >
- Isar >
- Mauthaus (Klimastation) >
- Chart of total period

Chart of total period Mauthaus (Klimastation)
Air pressure from 24.05.2012 to 30.04.2024
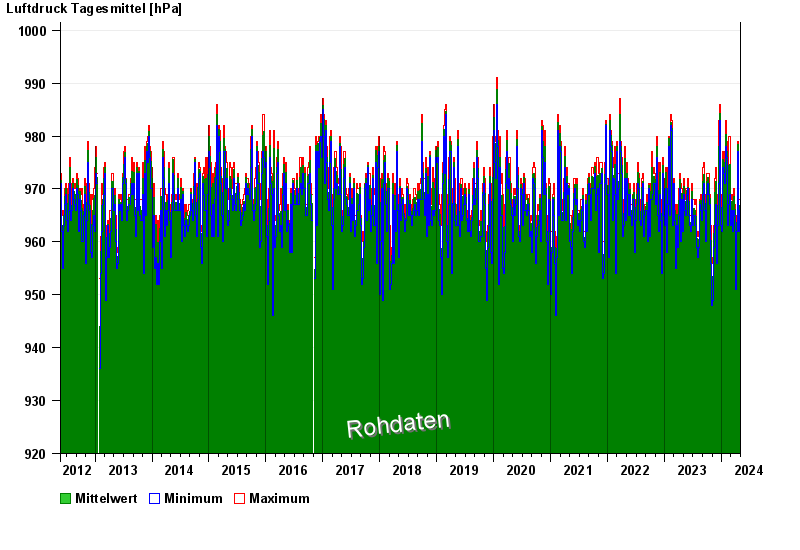
Note: The time series in the selected period has gaps.
| Date | Mean value [hPa] | Maximum [hPa] | Minimum [hPa] |
|---|---|---|---|
| 30.04.2024 | 962.8 | 967.0 | 960.0 |
| 29.04.2024 | 967.0 | 968.0 | 965.0 |
| 28.04.2024 | 959.6 | 965.0 | 957.0 |
| 27.04.2024 | 956.4 | 957.0 | 956.0 |
| 26.04.2024 | 953.5 | 956.0 | 953.0 |
| 25.04.2024 | 952.4 | 954.0 | 951.0 |
| 24.04.2024 | 953.8 | 958.0 | 952.0 |
© Bayerisches Landesamt für Umwelt 2024