
- Start >
- Meteorology >
- Air pressure >
- Inn >
- Rauschberg 2 >
- Chart of total period

Chart of total period Rauschberg 2
Air pressure from 16.07.2012 to 26.04.2024
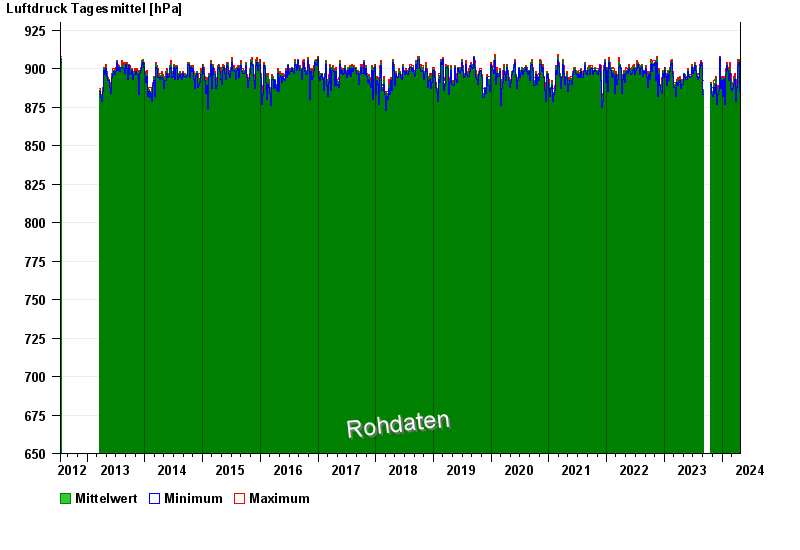
Note: The time series in the selected period has gaps.
| Date | Mean value [hPa] | Maximum [hPa] | Minimum [hPa] |
|---|---|---|---|
| 26.04.2024 | 880.0 | 880.0 | 880.0 |
| 25.04.2024 | 879.8 | 881.0 | 879.0 |
| 24.04.2024 | 880.4 | 882.0 | 879.0 |
| 23.04.2024 | 883.2 | 885.0 | 882.0 |
| 22.04.2024 | 886.5 | 887.0 | 885.0 |
| 21.04.2024 | 886.4 | 888.0 | 885.0 |
| 20.04.2024 | 884.9 | 889.0 | 881.0 |
© Bayerisches Landesamt für Umwelt 2024