
- Start >
- Meteorology >
- Air pressure >
- Bayern >
- Geretsried (Klima) >
- Chart of total period

Chart of total period Geretsried (Klima)
Air pressure from 08.03.2012 to 26.04.2024
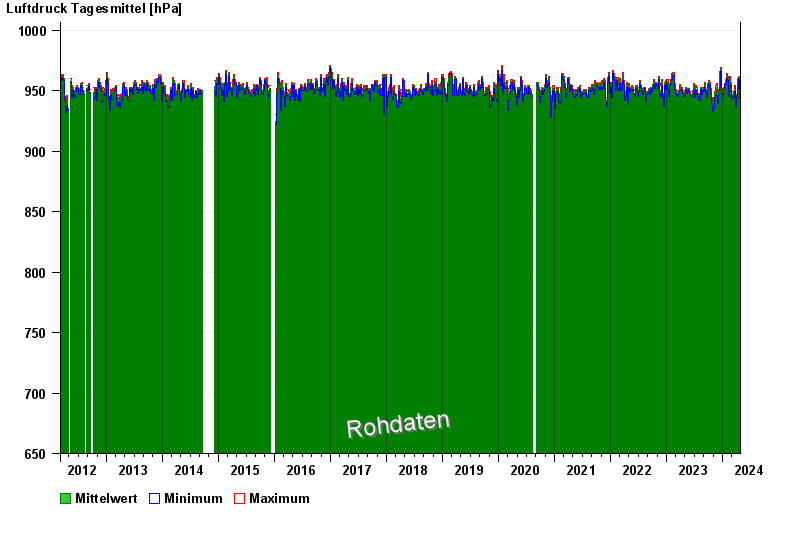
Note: The time series in the selected period has gaps.
| Date | Mean value [hPa] | Maximum [hPa] | Minimum [hPa] |
|---|---|---|---|
| 26.04.2024 | 937.0 | 937.0 | 937.0 |
| 25.04.2024 | 937.1 | 938.0 | 936.0 |
| 24.04.2024 | 938.4 | 941.0 | 936.0 |
| 23.04.2024 | 942.2 | 944.0 | 941.0 |
| 22.04.2024 | 945.5 | 946.0 | 944.0 |
| 21.04.2024 | 945.1 | 947.0 | 944.0 |
| 20.04.2024 | 944.3 | 948.0 | 940.0 |
© Bayerisches Landesamt für Umwelt 2024