
- Start >
- Meteorology >
- Air moisture >
- Untere Donau >
- Rotthalmünster >
- Chart of total period

Chart of total period Rotthalmünster
Air moisture from 14.09.2007 to 05.05.2024
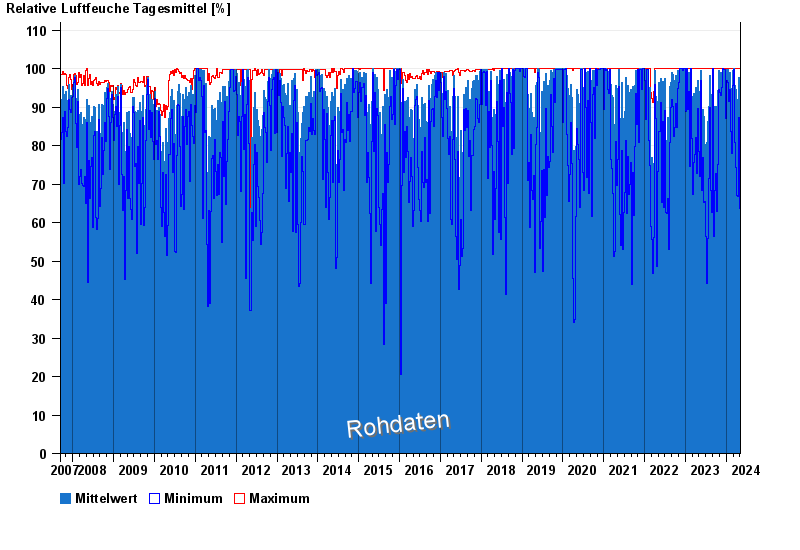
Note: The time series in the selected period has gaps.
| Date | Mean value [%] | Maximum [%] | Minimum [%] |
|---|---|---|---|
| 05.05.2024 | 100.0 | 100.0 | 100.0 |
| 04.05.2024 | 88.5 | 100.0 | 69.5 |
| 03.05.2024 | 94.6 | 100.0 | 83.8 |
| 02.05.2024 | 57.0 | 79.2 | 36.3 |
| 01.05.2024 | 60.0 | 84.0 | 46.2 |
| 30.04.2024 | 63.8 | 100.0 | 32.4 |
| 29.04.2024 | 77.7 | 100.0 | 41.2 |
© Bayerisches Landesamt für Umwelt 2024