
- Start >
- Meteorology >
- Air moisture >
- Untere Donau >
- Rothenfeld >
- Chart of total period

Chart of total period Rothenfeld
Air moisture from 22.05.2007 to 15.01.2026
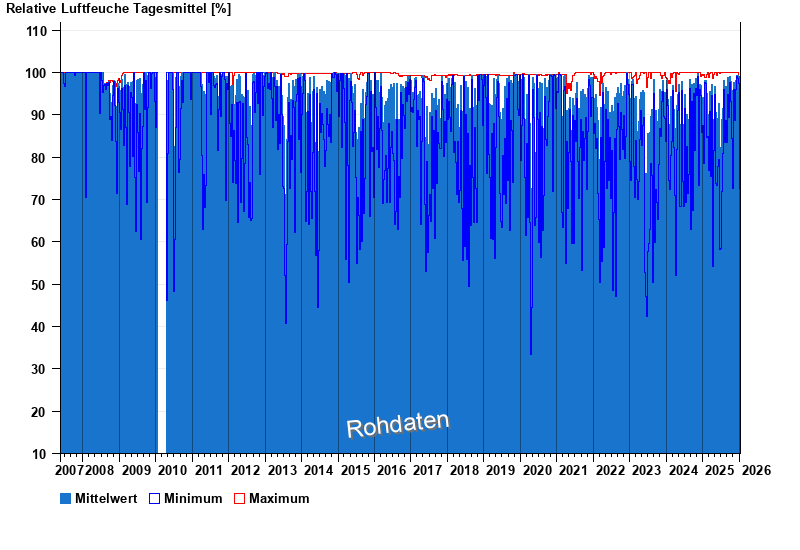
Note: The time series in the selected period has gaps.
| Date | Mean value [%] | Maximum [%] | Minimum [%] |
|---|---|---|---|
| 15.01.2026 | 70.4 | 90.4 | 50.4 |
| 14.01.2026 | 79.1 | 99.4 | 56.5 |
| 13.01.2026 | 82.8 | 99.2 | 63.8 |
| 12.01.2026 | 89.5 | 95.4 | 74.8 |
| 11.01.2026 | 89.9 | 95.9 | 79.6 |
| 10.01.2026 | 85.4 | 94.4 | 72.5 |
| 09.01.2026 | 79.7 | 97.0 | 63.4 |
© Bayerisches Landesamt für Umwelt 2026