
- Start >
- Meteorology >
- Air moisture >
- Untere Donau >
- Kringell >
- Chart of total period

Chart of total period Kringell
Air moisture from 12.07.1994 to 23.04.2024
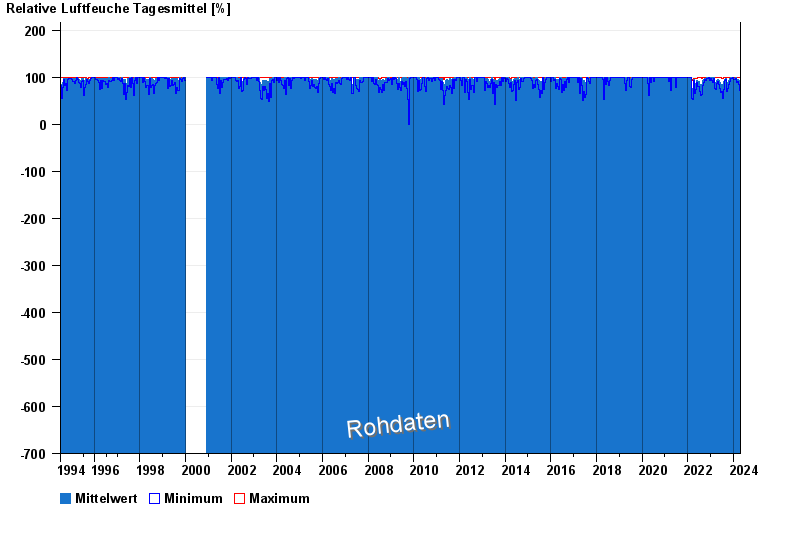
Note: The time series in the selected period has gaps.
| Date | Mean value [%] | Maximum [%] | Minimum [%] |
|---|---|---|---|
| 23.04.2024 | 71.0 | 77.9 | 63.4 |
| 22.04.2024 | 62.7 | 86.2 | 45.7 |
| 21.04.2024 | 89.7 | 99.3 | 61.7 |
| 20.04.2024 | 91.3 | 97.3 | 82.7 |
| 19.04.2024 | 93.4 | 98.9 | 76.6 |
| 18.04.2024 | 91.7 | 98.0 | 76.9 |
| 17.04.2024 | 89.6 | 98.2 | 70.8 |
© Bayerisches Landesamt für Umwelt 2024