
- Start >
- Meteorology >
- Air moisture >
- Untere Donau >
- Frankenhofen >
- Chart of total period

Chart of total period Frankenhofen
Air moisture from 19.07.1994 to 02.05.2024
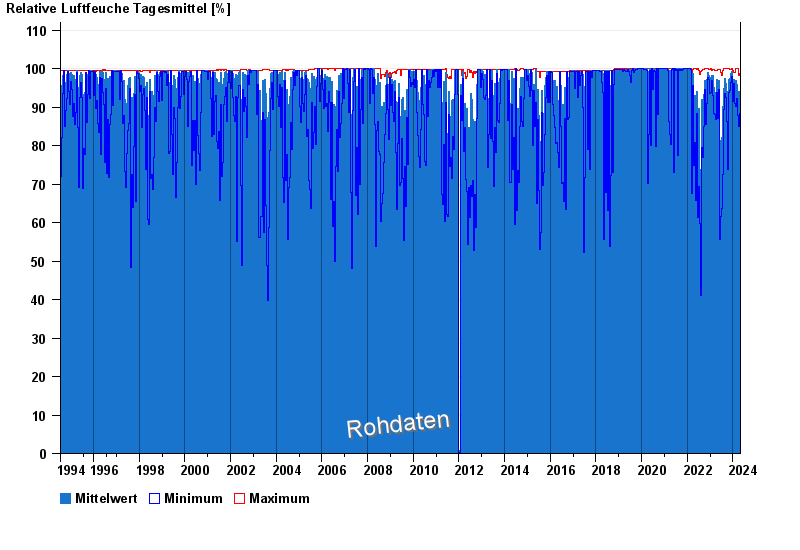
Note: The time series in the selected period has gaps.
| Date | Mean value [%] | Maximum [%] | Minimum [%] |
|---|---|---|---|
| 02.05.2024 | 79.5 | 79.5 | 79.5 |
| 01.05.2024 | 62.2 | 91.4 | 34.8 |
| 30.04.2024 | 63.9 | 96.9 | 29.7 |
| 29.04.2024 | 67.7 | 94.5 | 41.1 |
| 28.04.2024 | 66.5 | 86.0 | 40.8 |
| 27.04.2024 | 64.7 | 98.7 | 32.0 |
| 26.04.2024 | 75.9 | 97.5 | 52.2 |
© Bayerisches Landesamt für Umwelt 2024