
- Start >
- Meteorology >
- Air moisture >
- Untere Donau >
- Eschlkam >
- Chart of total period

Chart of total period Eschlkam
Air moisture from 06.07.2017 to 27.04.2024
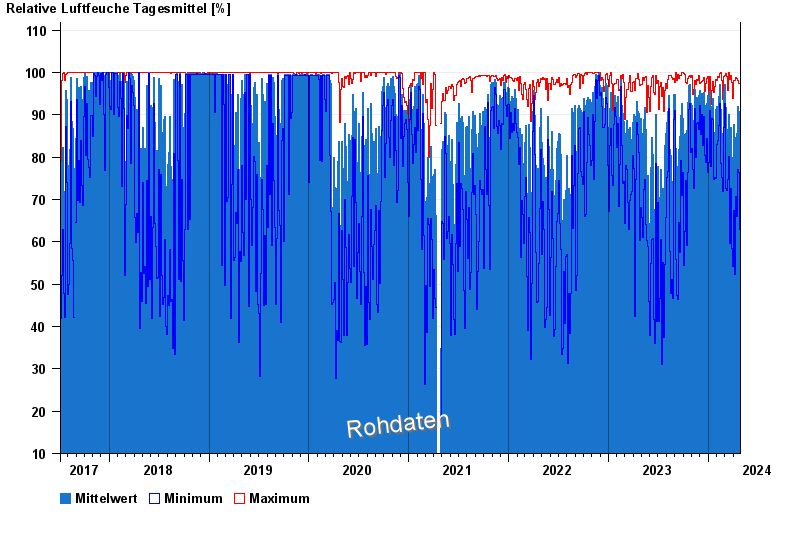
Note: The time series in the selected period has gaps.
| Date | Mean value [%] | Maximum [%] | Minimum [%] |
|---|---|---|---|
| 27.04.2024 | 65.9 | 95.8 | 28.9 |
| 26.04.2024 | 70.0 | 97.4 | 42.0 |
| 25.04.2024 | 83.7 | 92.4 | 62.3 |
| 24.04.2024 | 75.8 | 89.5 | 53.9 |
| 23.04.2024 | 74.2 | 85.6 | 62.9 |
| 22.04.2024 | 71.2 | 92.8 | 52.7 |
| 21.04.2024 | 88.3 | 95.8 | 76.2 |
© Bayerisches Landesamt für Umwelt 2024